| Diagnosis | Patients | Procedures | Men | Women | Mean age (years) | SD | Median age (years) | IQR |
|---|---|---|---|---|---|---|---|---|
| All | 1,175 | 1,232 | 760 | 415 | 64 | 14 | 66.0 | 57 - 73 |
| ENT | 582 | 611 | 402 | 180 | 64 | 10 | 65.0 | 58 - 71 |
| MND | 177 | 184 | 99 | 78 | 64 | 11 | 66.0 | 58 - 72 |
| CVA | 127 | 132 | 69 | 58 | 74 | 13 | 76.0 | 67 - 84 |
| INJ | 72 | 83 | 59 | 13 | 58 | 16 | 58.5 | 48 - 70 |
| NEU | 89 | 89 | 57 | 32 | 55 | 19 | 60.0 | 42 - 70 |
| UNK | 79 | 80 | 47 | 32 | 57 | 23 | 63.0 | 41 - 75.5 |
| OES | 49 | 53 | 27 | 22 | 69 | 10 | 68.0 | 60 - 76 |
Radiological gastrostomy - patient demography
- Included are data about 1232 gastrostomies performed on 1175 patients between 2014-01-06 and 2025-12-17
- Repeat gastrostomies are counted only if the new gastrostomy required a new gastric puncture.
- Re-canalisation of existing tracts with a wire are not included.
Gastrostomy demography
- The table below summarises the sex and age of gastrostomy patients:
Age
- In terms of age, the appropriate location and spread of data depends on whether or not it is normally distributed.
- For each diagnosis, this can be visualised by histograms, as below:
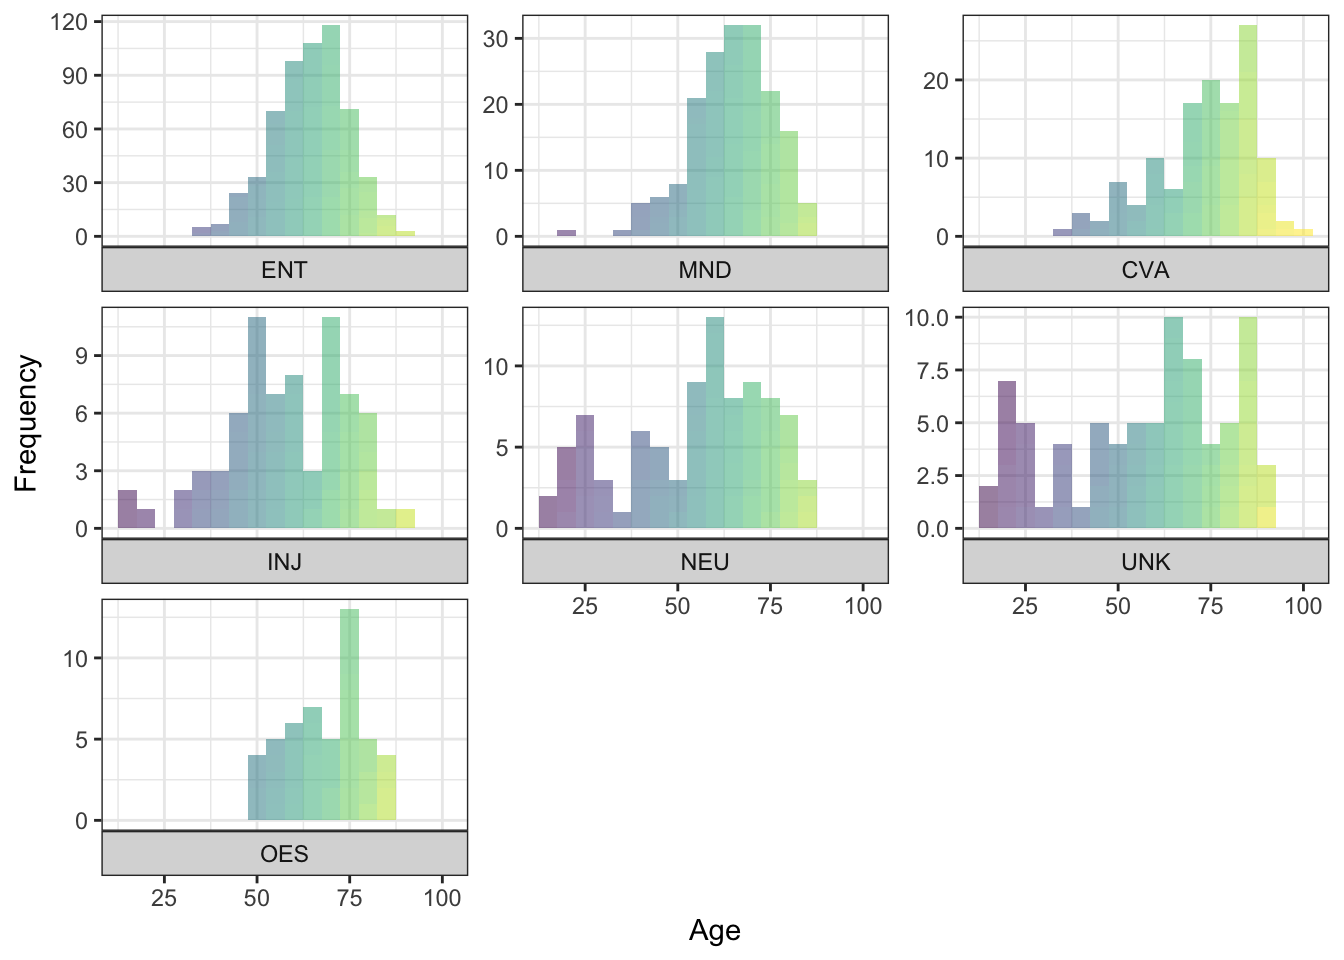
- It can also be tested statistically with the Shapiro Wilk test of normality.
- With the null hypothesis being that the population is evenly distributed, the p values are as follows:
ENT: p = 0.00122288691142856
MND: p = 0.0011087080722952
CVA: p = 9.94030112283994e-05
INJ: p = 0.155942145137917
NEU: p = 0.000496076234366161
UNK: p = 0.000237299741540943
OES: p = 0.118071235283747
Mean and standard deviation are appropriate where p > 0.05, median and interquartile range when the opposite is true.
Finally, an idea of the location and spread of the ages as well as the number of patients for each diagnosis can be visualised in a point plot, where each point represents a single patient:
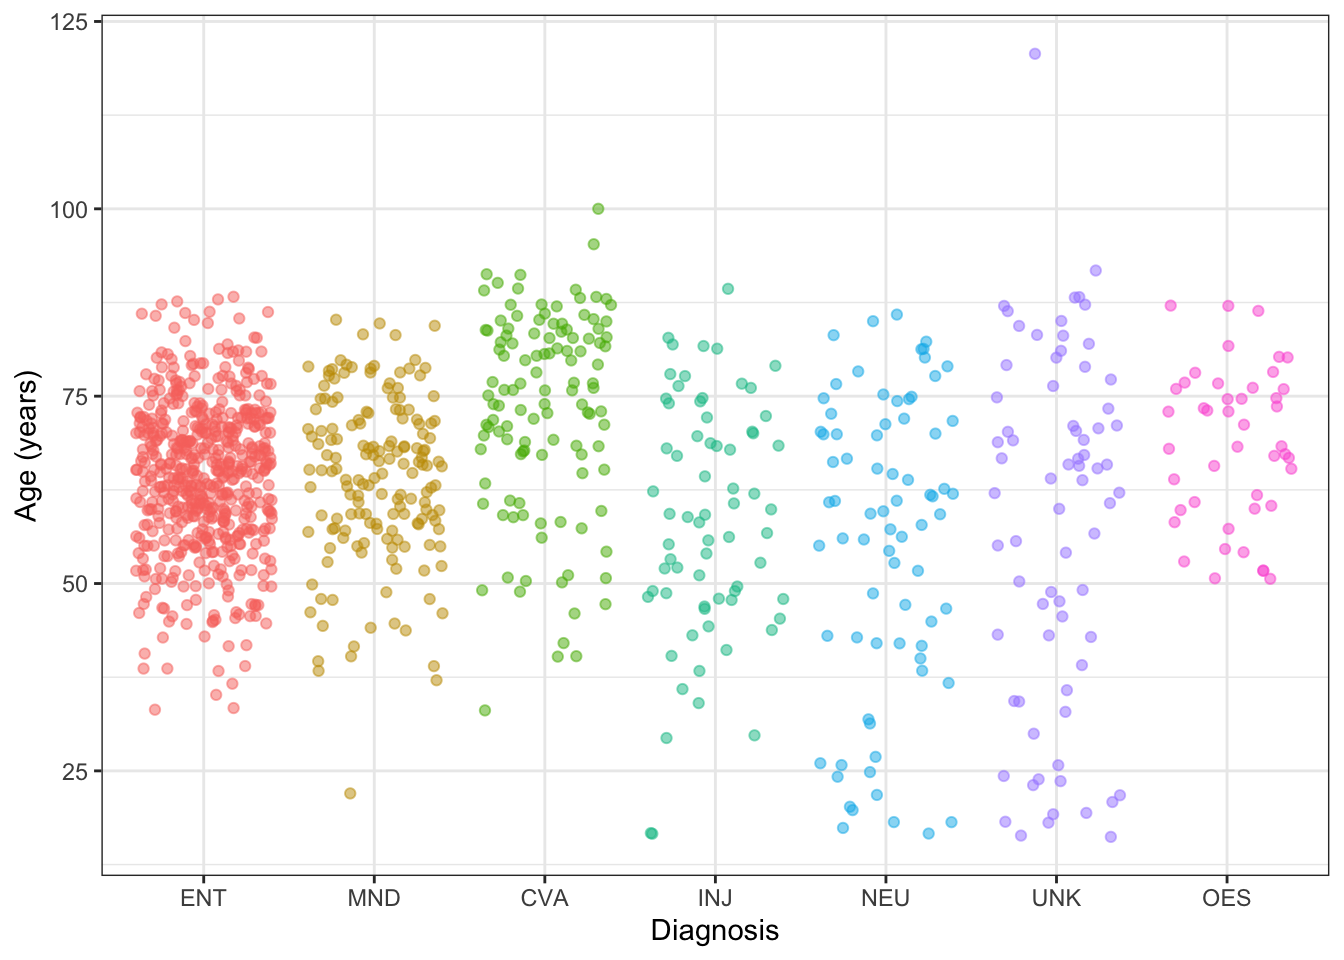
- Note, random jitter has been applied to decrease overlap of points on the chart.
Abbreviations used above are as follows:
- ENT: ear, nose and throat cancers and their management
- MND: motor neurone disease
- CVA: stroke
- OES: oesophageal disease
- NEU: other neurodegenerative diseases
- INJ: traumatic brain and spine injuries
- UNK: the remaining miscellaneous or un-diagnosed conditions