Radiological gastrostomy - monthly variation
- Included are data about 1232 gastrostomies performed on 1175 patients between 2014-01-06 and 2025-12-17
- Repeat gastrostomies are counted only if the new gastrostomy required a new gastric puncture.
- Re-canalisation of existing tracts with a wire are not included.
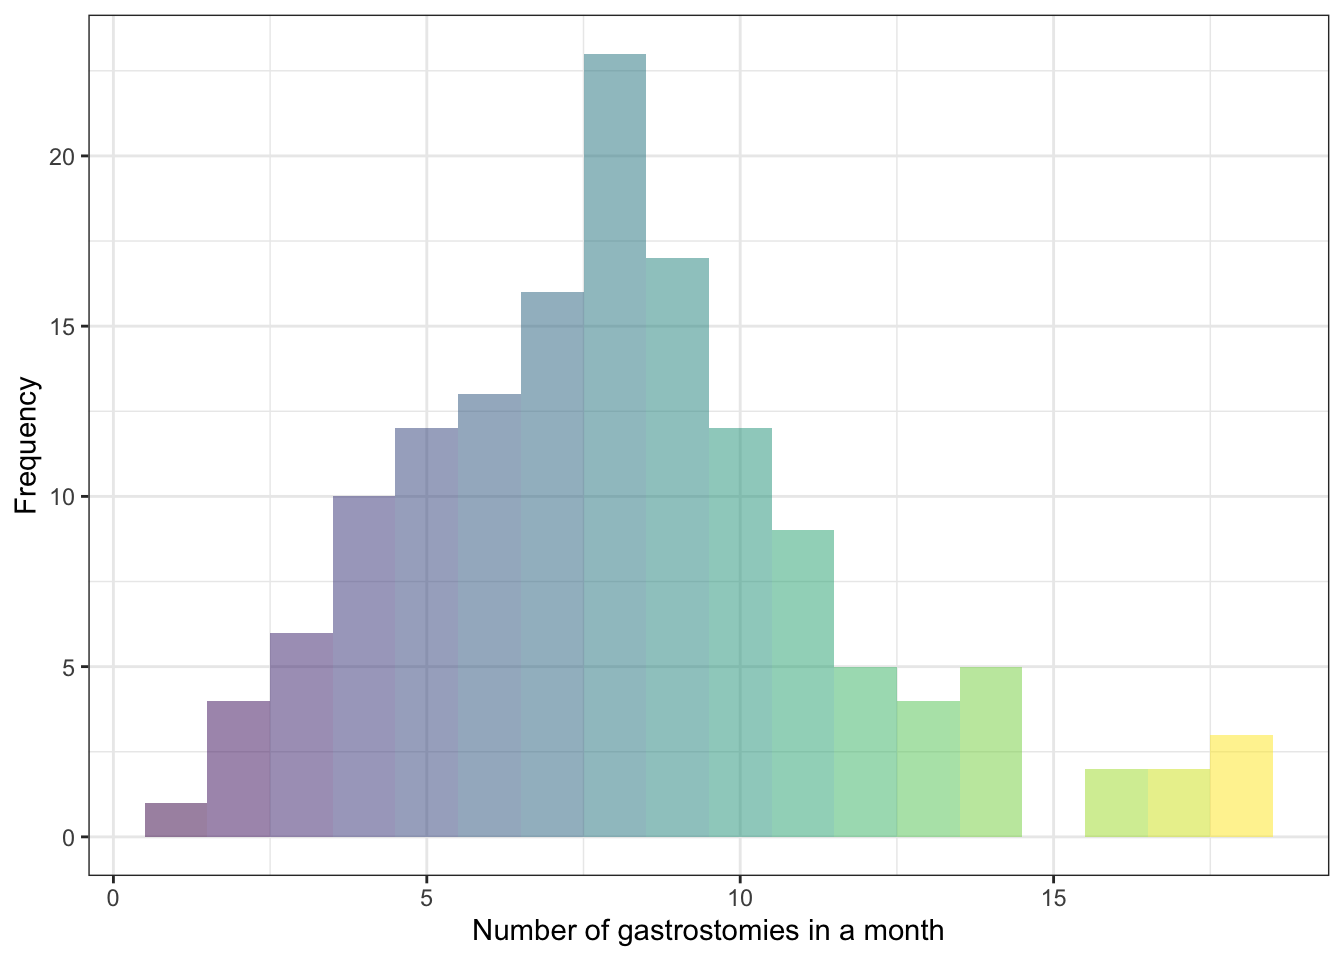
Number of gastrostomies performed in a given month
Between 1 and 18 gastrostomies per month have been performed in the previous 144 months
These data can be displayed as a histogram:
The data look quite evenly distributed but this can be tested with the Shapiro-Wilk test of normality.
With the null hypothesis being even distribution, p = 6.1028756^{-4}
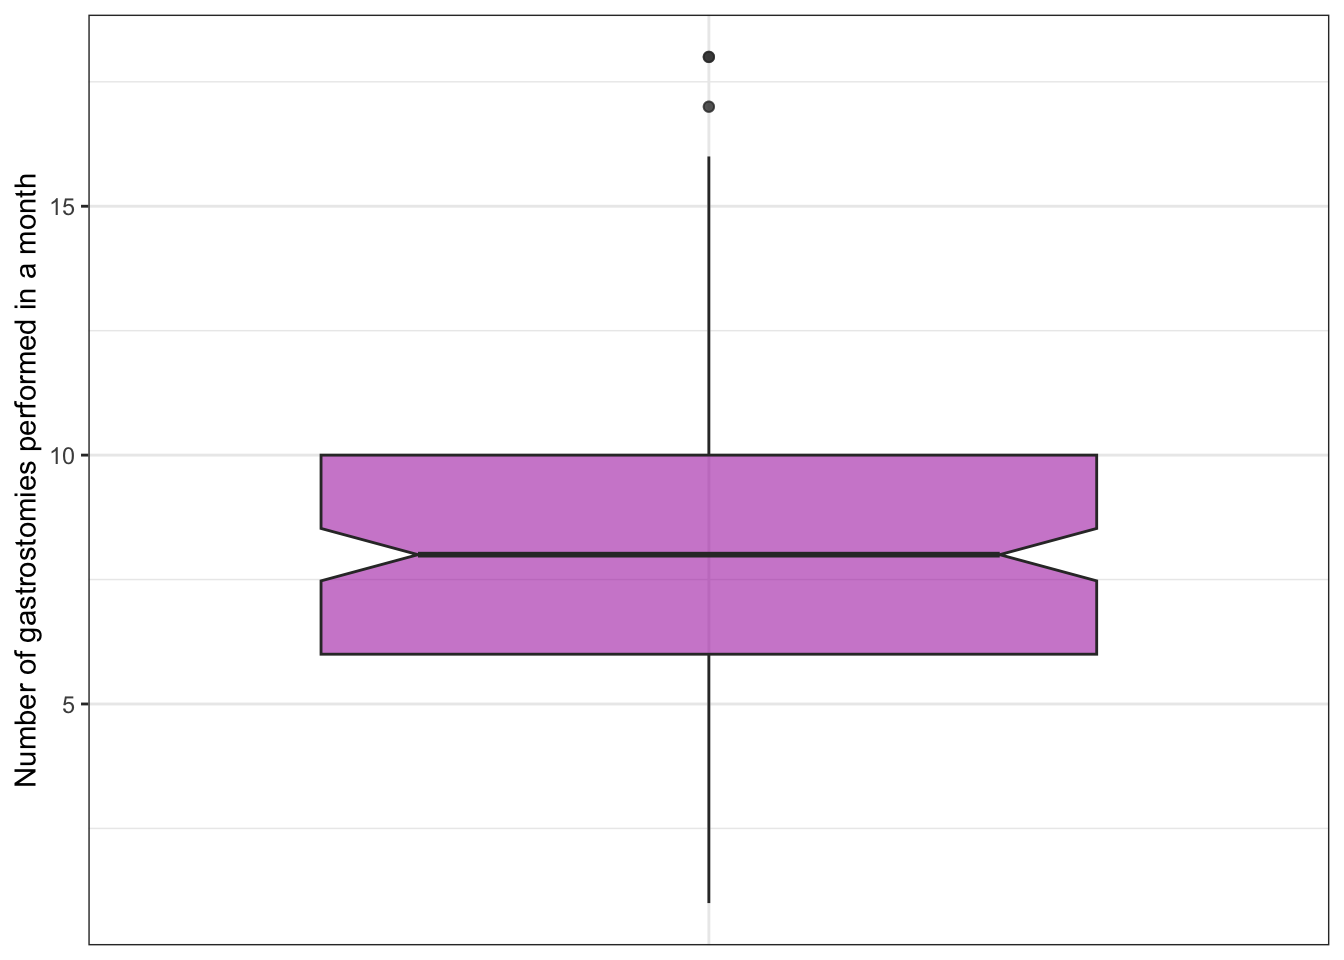
Median = 8 (IQR 6-10)
These can also be displayed as a boxplot:
30-day mortality in a given month
- The frequency of the number of times 30-day mortality occurs in a month can be show as a histogram:
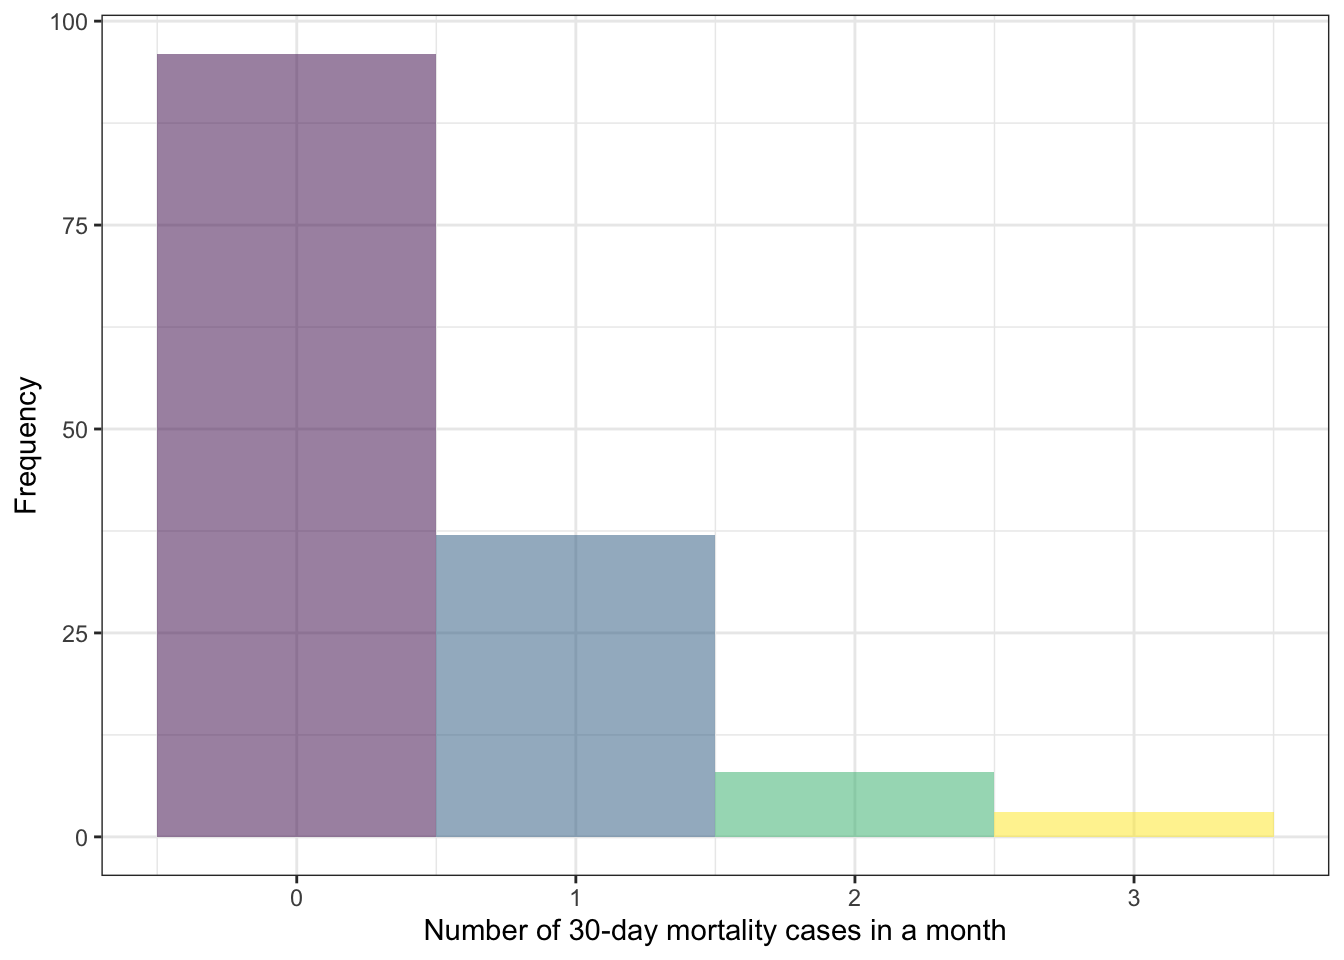
To test these numbers of deaths are within the expectation of random variation, we can use Poisson probability statistics.
A Poisson probability test expresses the probability of a given number of events (30-day mortality) occurring in a fixed time interval (one month), assuming new events are independent of events in the previous time interval (the previous month’s deaths do not influence the probability of the following month’s deaths), based only on a known mean rate (0.4305556).
The table below presents observed 30-day mortality numbers and those expected by Poisson probablity:
| Patients dead at 30 days | Observed frequency | Expected frequency |
|---|---|---|
| 0 | 96 | 94 |
| 1 | 37 | 40 |
| 2 | 8 | 9 |
| 3 | 3 | 1 |
- Chi squared test with the null hypothesis that there is no difference between observed and expected frequencies: p = 1
Percentage 30-day mortality in a given month
- As monthly procedures vary widely, expressing the number who die each month as a percentage results in the following histogram:
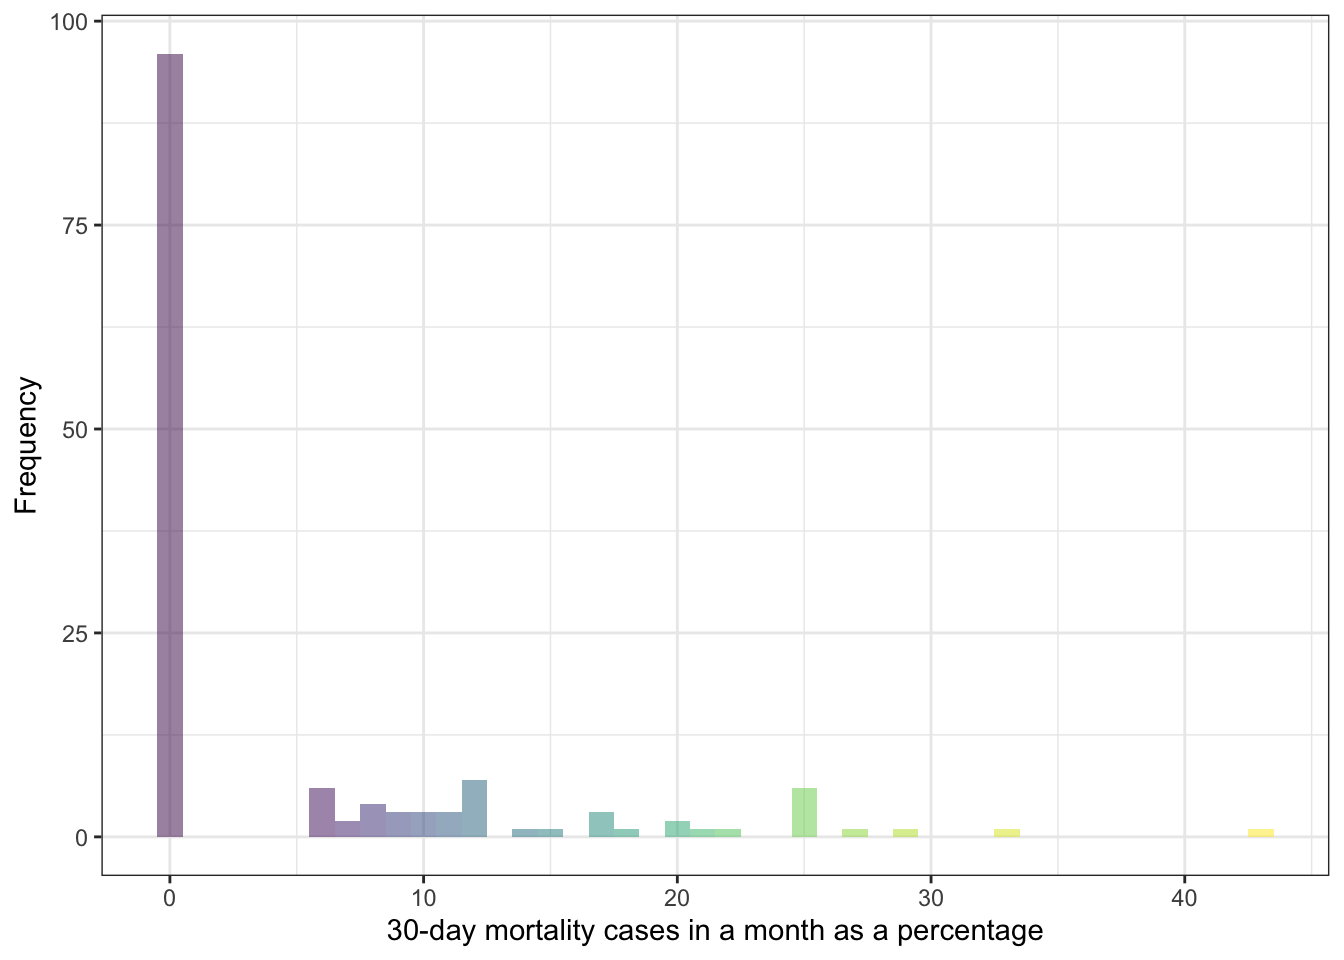
- However, this is much more clearly visualised as a funnel plot:
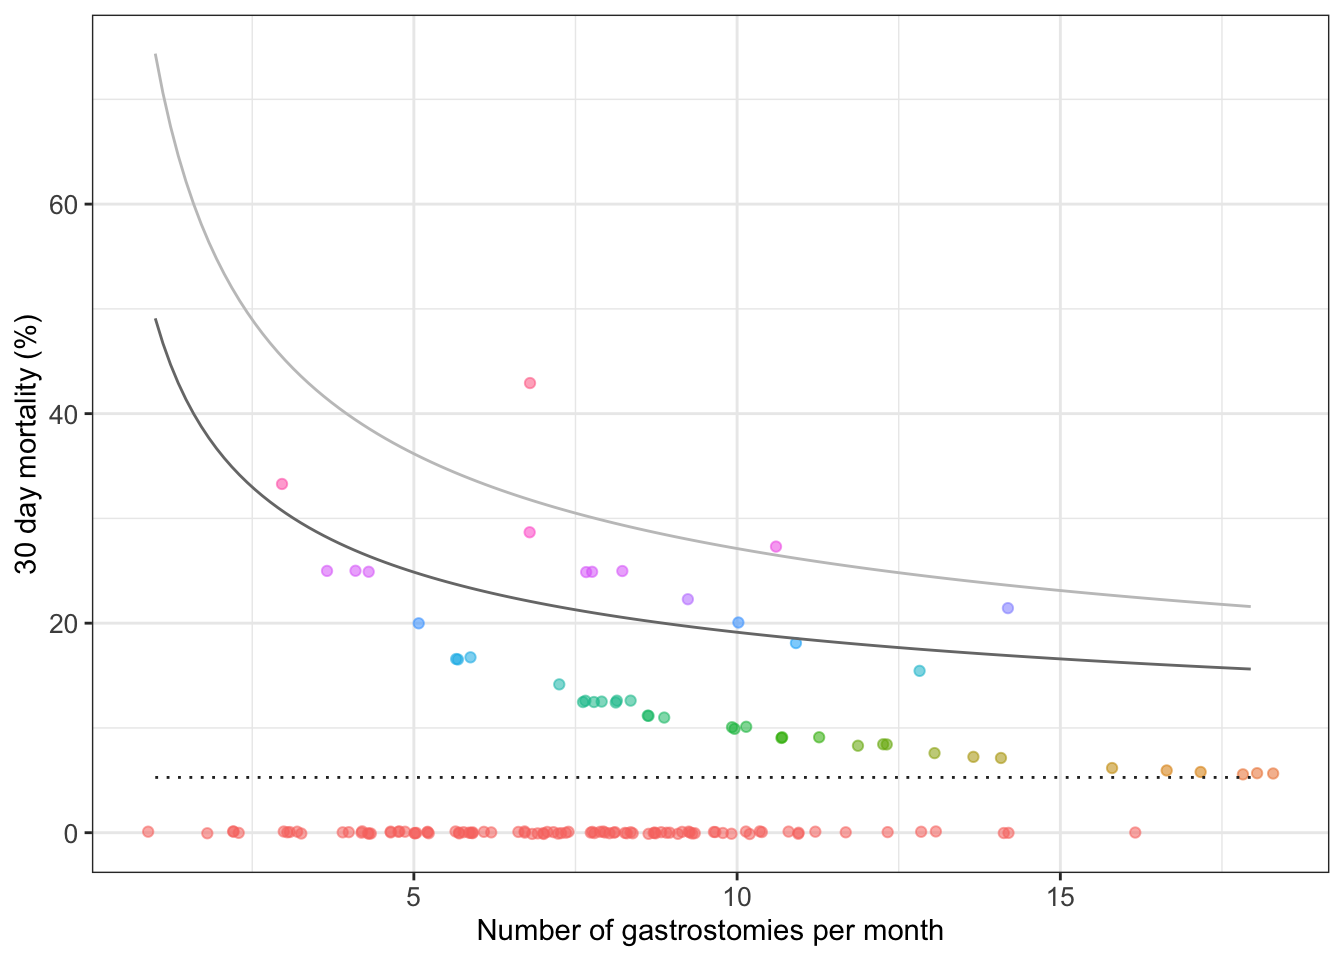
- Note, random jitter has been applied to the plot to reduce overlap of points and aid clarity
- The colour of the points corresponds to their baseline y-axis value
Abbreviations used above are as follows:
- ENT: ear, nose and throat cancers and their management
- MND: motor neurone disease
- CVA: stroke
- OES: oesophageal disease
- NEU: other neurodegenerative diseases
- INJ: traumatic brain and spine injuries
- UNK: the remaining miscellaneous or un-diagnosed conditions