Ignoring unknown labels:
• colour : ""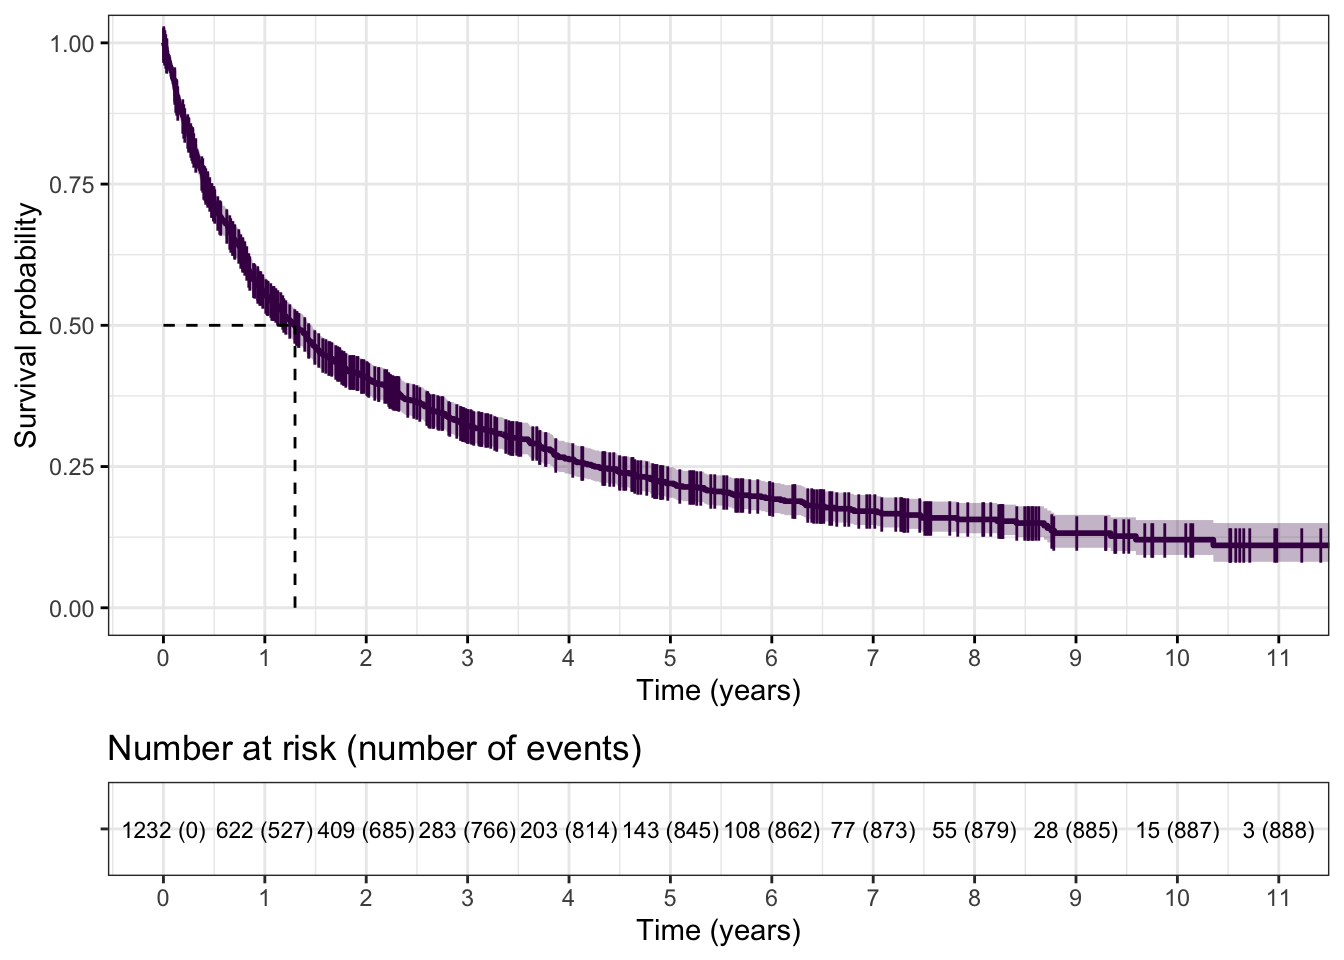
Ignoring unknown labels:
• colour : ""
Ignoring unknown labels:
• colour : "Diagnosis"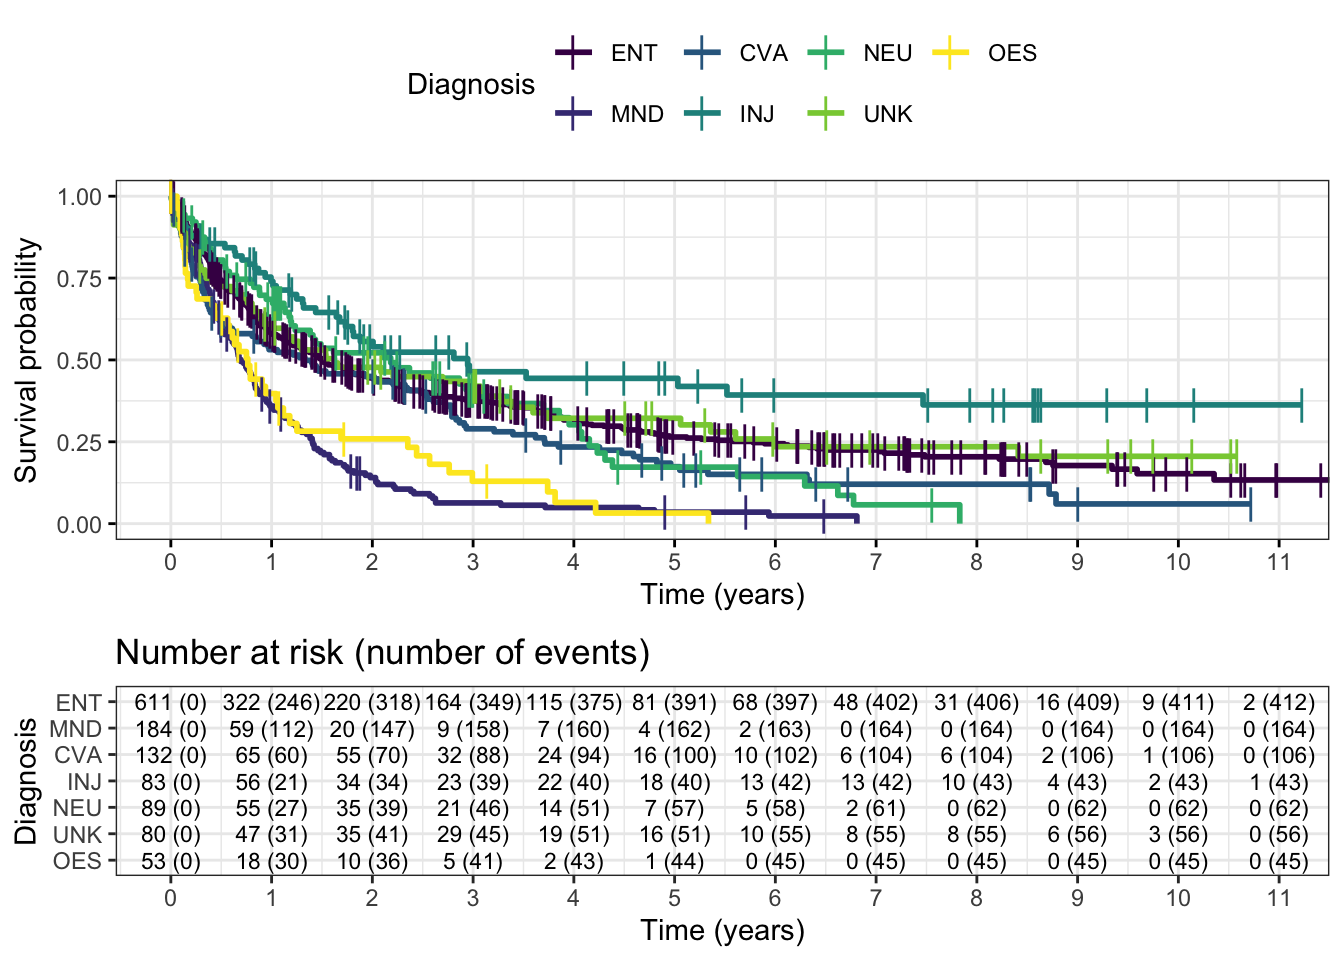
| Diagnosis | Procedures | Median survival (days) | 95% CIs |
|---|---|---|---|
| All | 1,232 | 474 | ( 424 - 533 ) |
| ENT | 611 | 549 | ( 466 - 669 ) |
| MND | 184 | 254 | ( 215 - 306 ) |
| CVA | 132 | 486 | ( 295 - 907 ) |
| INJ | 83 | 1,076 | ( 659 - NA ) |
| NEU | 89 | 797 | ( 451 - 1351 ) |
| UNK | 80 | 593 | ( 370 - 1248 ) |
| OES | 53 | 279 | ( 206 - 408 ) |
Ignoring unknown labels:
• colour : ""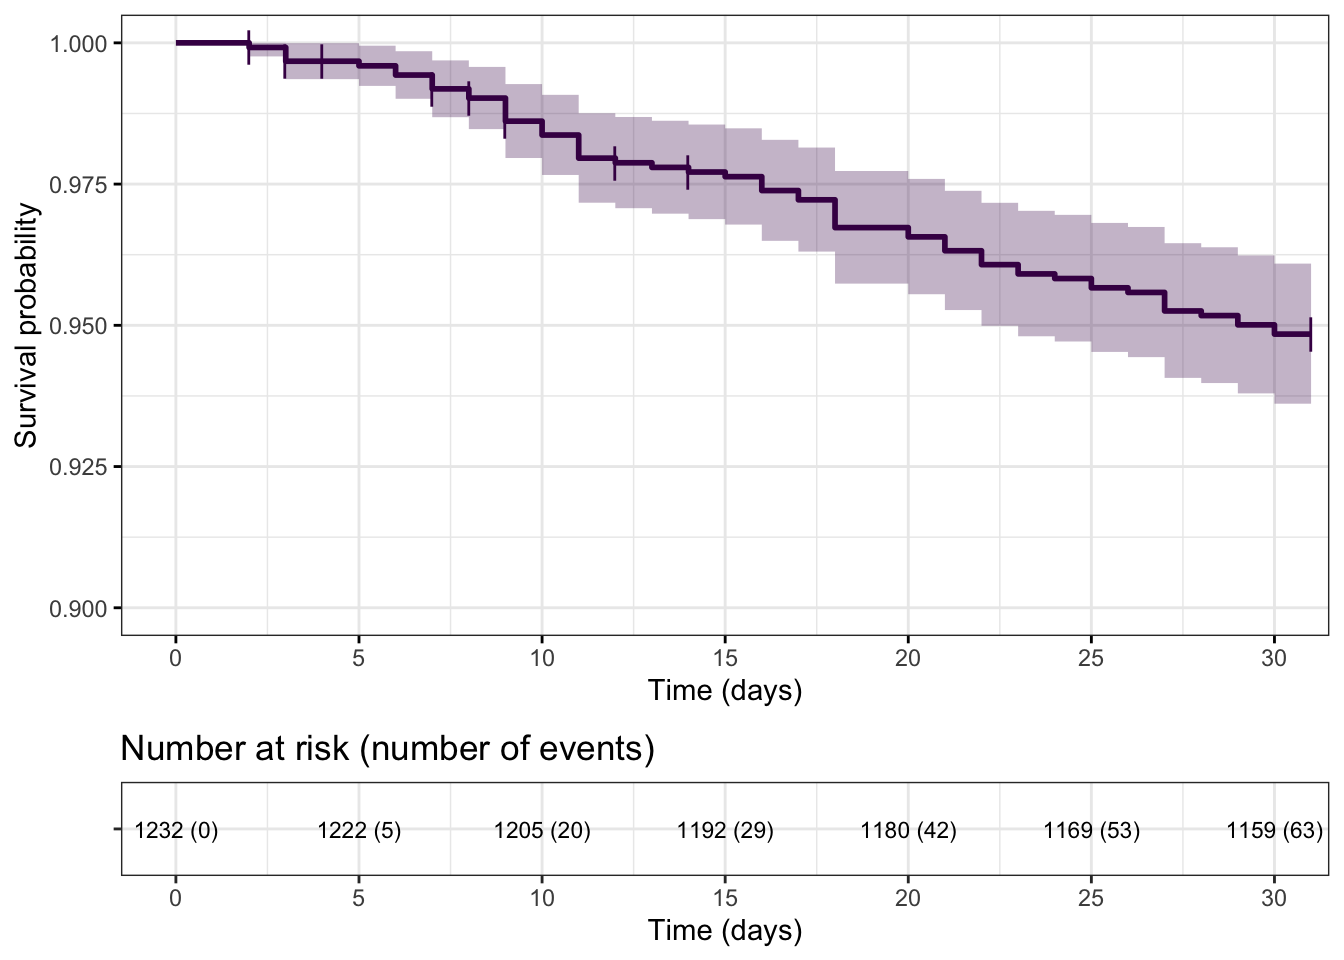
Ignoring unknown labels:
• colour : "Diagnosis"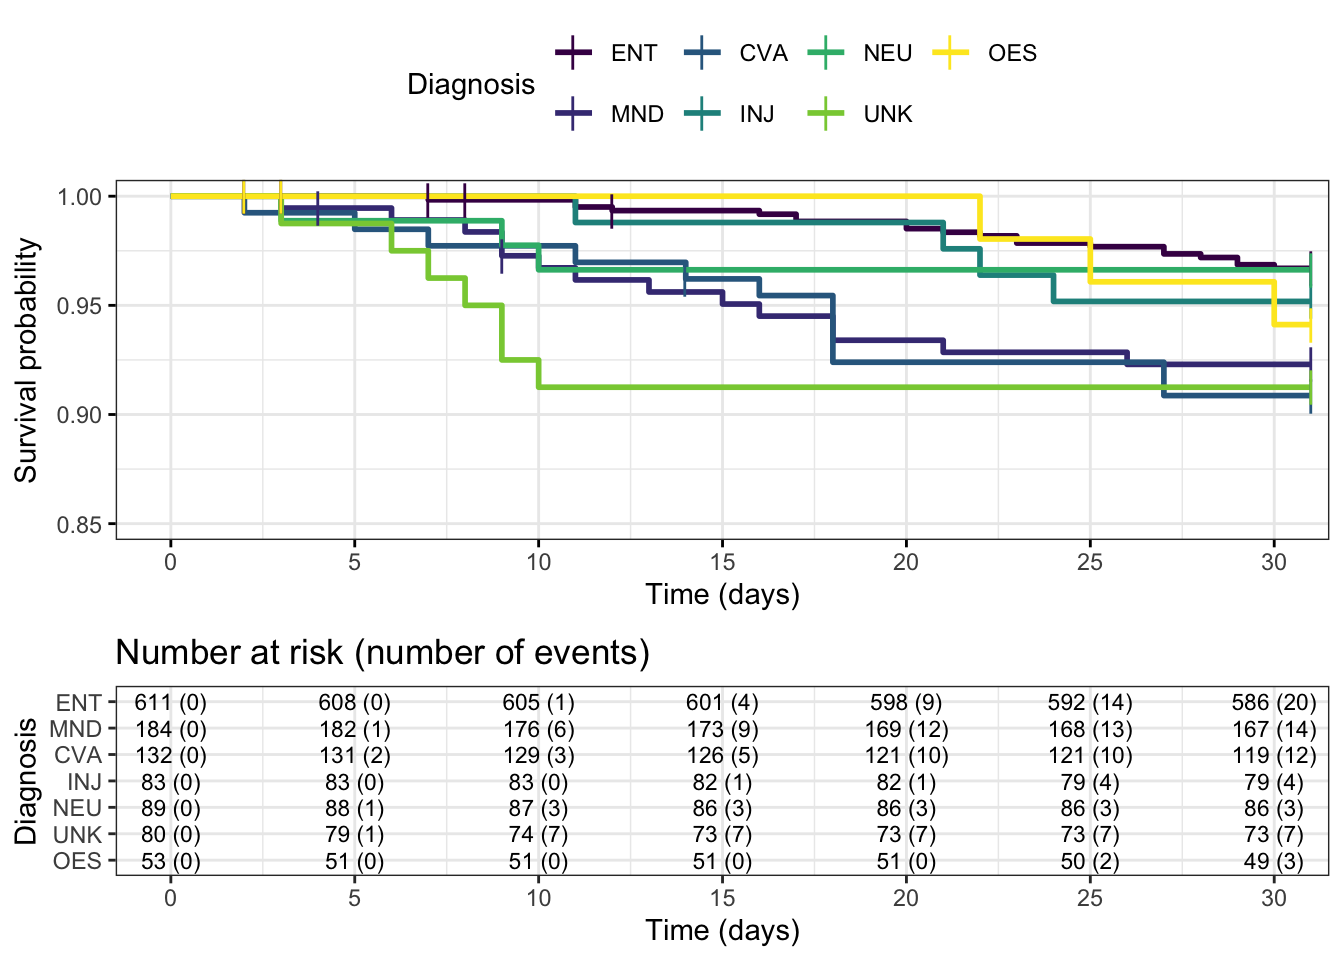
Abbreviations used above are as follows: